5K a Day all about the Data
You asked for it so let’s dive into the data! I knew this was going to be a follow-up post to the one I just wrote earlier this week about my 5K a day. Maybe it is because I am kind of a data nerd and you were shocked I didn’t publish any data or charts with my last article. Or maybe it is because you wanted to see when and how far, fast or what time of day I completed my runs. It could have been that you were not 100% sure you believed me in my last article and were waiting to see some proof.
 The glow of the sunrise in the clouds and off the water is something that never gets old for me (April 2019, Eden Prairie, MN)
I didn’t put it in the other article because I had some real hesitations about posting it. Not because I am trying to hide anything, in fact, you can follow my Strava account if you are a runner and like doing that type of thing. The reason was that the data is not perfect and it took me some time putting it all together. I am not going to bore you with all of those details in this post as I might have to save those issues for another. However, all of the data in the charts came from Strava and Fitbit.
So without further ado, here are some fun charts to look at from the past year where I completed 1189.45 miles with a little color commentary.
When did you run?
This is one of the first questions I got after my previous post, When did I do most of my running? I have been asked this question by friends and family members before and without looking at the chart my answer was always the morning without a doubt. With 3 kids in activities, the morning was the one time I could really control what I did. If I didn’t do it first thing there was always a chance that plans could change and I would be doing it at midnight. However, it did get me thinking about how often I ran the rest of the day over the past 12 months.
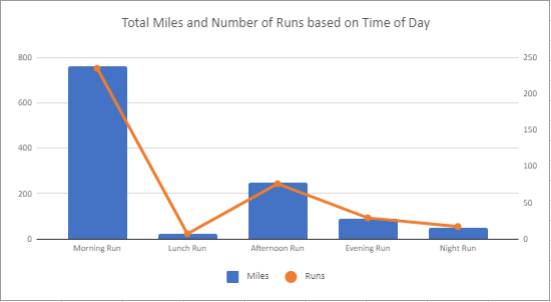 As you can see morning took it by a landslide. Now that it is Fall again and almost time for Winter I was reminded that running in the dark is not my favorite as I have been spoiled for the last 3-4 months of the morning running with the sunrise. This morning I just cranked out 6 miles and it was all in darkness.
 Always a win when I would find a new route that actually has some street lights (Septemeber 2018, Eden Prairie, MN)
 Completed my annual self made “Turkey Trot” in the early morning hours while watching the sunrise (November 2018, Nevada, IA)
Now being the data nerd I am I was thinking the next best slice would be to see a number of runs/miles by the day of the week. I was interested to see that I ran fewer miles on the weekend than I did during the week.
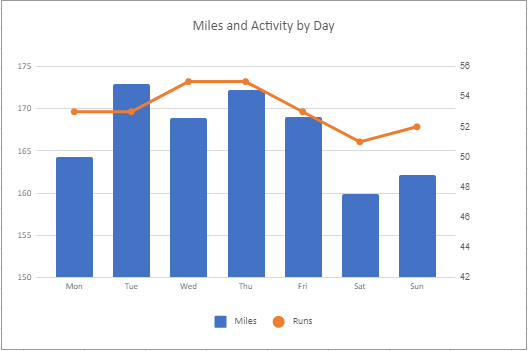
Now here is where I am going to kind of skate over data quality because it might be more valuable in another post as I will probably rant quite a bit on that topic. However, I have some double runs during the middle of some weeks due to international flights. In addition, not to play down my commitment to running because there were a couple of times in the past year I ran twice a day by CHOICE! You read that right I chose to run not only in the morning but at night as well. Don’t worry I didn’t make a habit out of it and it only happened because as I said previously I sometimes had to plan a week out in advance. Obviously, since I mostly wanted to get my runs done early as a way to not forget, someone would message me mid-day seeing if I wanted to run that evening. I mean how could I say no?
Friday Mornings take the real WIN!
After looking at that last set of data I pondered if there was anything else I would like to see. That is when it hit me that it would be interesting to see based on the day of the week when did I typically run.
I was not really sure what to expect on this chart before pulling it together. The only thing I could think of was besides mornings probably being pretty spread out during a given week. I would have thought more evening runs as I would try to squeeze them in right after work or while at a kid’s activity. As you can see from the data below, that is not entirely what is being shown.
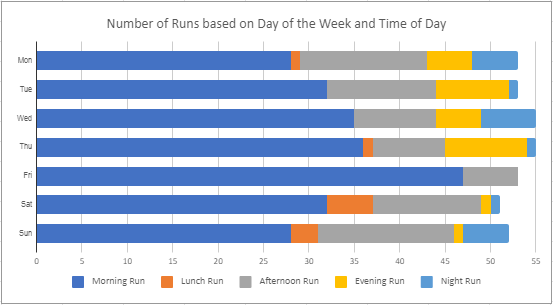
After looking over the chart below I came to two realizations:
- I am not sure how Strava categorizes Morning, Lunch, Afternoon, Evening or Night run. The biggest problem I see here is that there is a big gap between what I would consider Morning and Lunch. Then in the afternoon and evening, I am not sure what that fine line is to trip it from Lunch to Afternoon to evening. I spot checked a couple of specific days and it was counting afternoon as 5:50 PM. Not sure if that is where it should fall but then the data started to make more sense as in the winter months for sure I ran more in the early evening (or still Afternoon) while my son played basketball.
- I made a concerted effort to never run at night on Friday and in fact, it was the heaviest day of morning runs. I had never really thought of it but accept what the data says. Most of my Friday nights kids don’t have activities so with that in mind we are either doing something as a family at home or traveling somewhere for the weekend. Not to mention if you want to have a drink with the neighbor while grilling after work on a Friday it is best to get you run in early.
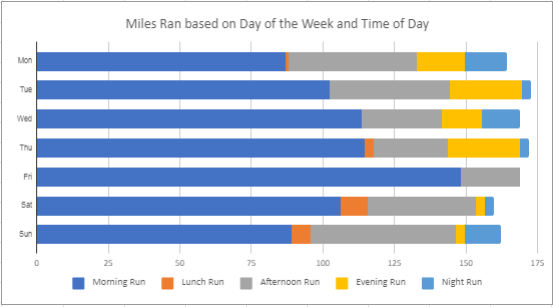
I also did a similar slice based on miles but as you can see it didn’t really tell me anything as the chart looks about the same since I was always hovering around 3.1 miles with very rare exceptions though most of and then at the end.
Pace
Finally, after I was pulling all this data together I was wondering what was my average pace over the course of these 12 months. The overall answer is 7:47 min miles. I decided to create some quick average charts by day and month. The day chart kind of puzzled me except when thinking about the other data above. I most likely got better rest before my Saturday run as I didn’t always have to do it at dawn.
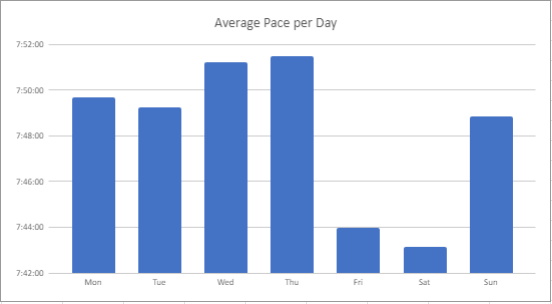
When you look at the monthly chart this is even more interesting but I have a few ideas of why it might look like it does.
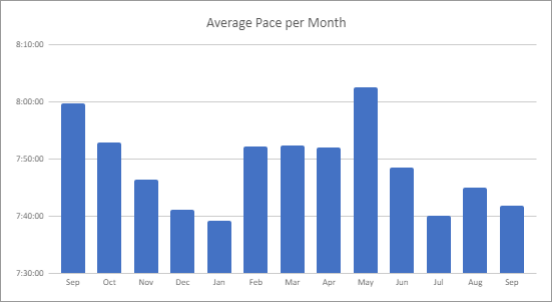
From when I started till about January I was on a steady decline. However, those runs were mostly solo in nature and a more consistent route due to darkness, and early snowfall. Don’t forget it got cold in January and I might have tried to run faster outside just to get the run done in the early morning.
 Running with my daughter and the dog. Not a bad way to start the day as it is always filled with conversations. Not to mention more stops by both to see and listen to nature (March 2019, Eden Prairie, MN)
 Frozen face run in -9.4°F (February 2019, Eden Prairie MN)
The Spring months I was running more with Lainey Lou the Doodle (our dog) which then slowed down my pace. In addition, I would run sometimes with my daughter who would like to bike along with me and sometimes she just wanted to stop. Finally, in the late April / May timeframe it was starting to get nicer out that I could do more trails around the area. In May especially, I was traveling and was running in the hills of Arizona, streets of China and a number of Treadmill runs due to the arrival of flights. I know that Treadmill run data was about the worst because I only have my watch data to go on and most of the time it never said I ran as far as the treadmill said I did.
So after all of my analysis above, I got to thinking I might be missing some data here that might be in addition to the chart above. The one above only gave average pace but I was more curious about what the min and max were as well. I think this chart helps answer some of those questions.
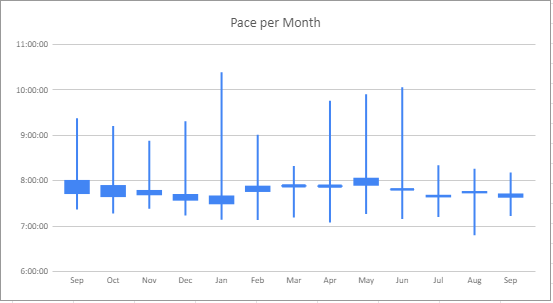
Looking at the chart above I think it further supports my hypothesis of running in different places and on the treadmill.
Fastest Times
| Best Efforts | |
|---|---|
| 1k | 4:05 |
| 1 mile | 6:36 |
| 5k | 20:58 |
| 10k | 46:39 |
I figured since I was sharing all of this data anyways I should probably share some Personal Bests during my year of running. I was thinking of doing a chart like some of the above but I realized I didn’t really have good data around this. Mostly because I didn’t always stop running right at 3.1 miles, so it would be hard with the data I have to give more meaning than overall bests.
Luckily, Strava has some overall personal bests that I could easily get and all of them except for the 10k came from a race I did in the summer. In looking at the data now, I wish I would have broken the 20 min mark but I can’t really complain as I was never shooting for a specific time. Also, I did well as I was in the top 15 overall and 2nd in my age group.
I actually did 2 races over the past year and surprised myself during both of them with good enough times considering I was running every day with no breaks. Running a 5k a day made me realize that running those 5K races were really nothing. I did them every day so it wasn’t a big deal, I knew I would finish it so then it was just a matter of at what point in the race should I pick up my pace or pass someone.
Conclusion
I never really set out to put any data together when I originally started running. In fact, I didn’t really think about it when I realized that I was actually going to be running for a year. To both of those facts, I might have been a little short-sided, as looking back I would have done things differently in order to make sure I had the data easily available. I would not have used it to change what happened on a day to day basis as my goal was never to run faster or even longer. I did use my Strava data and my Fitbit data to just look back at a given week or compare runs every now and then to see if there was any small progress. However, my ultimate goal was the consistency of doing it every day.